RuiDesign
Download CV ↗

06 · UX research

Laughter.

How people respond to a co-viewer presented as human or AI.

An exploratory study with 48 participants. I built the experiment, analysed the response logs in Excel, and connected behaviour with how participants interpreted their partner.

Year
2026
Context
MSc User Experience Engineering, Goldsmiths · Final project
Method
Behavioural experiment · 48 participants · Excel analysis
My role
Individual project, from study design to analysis
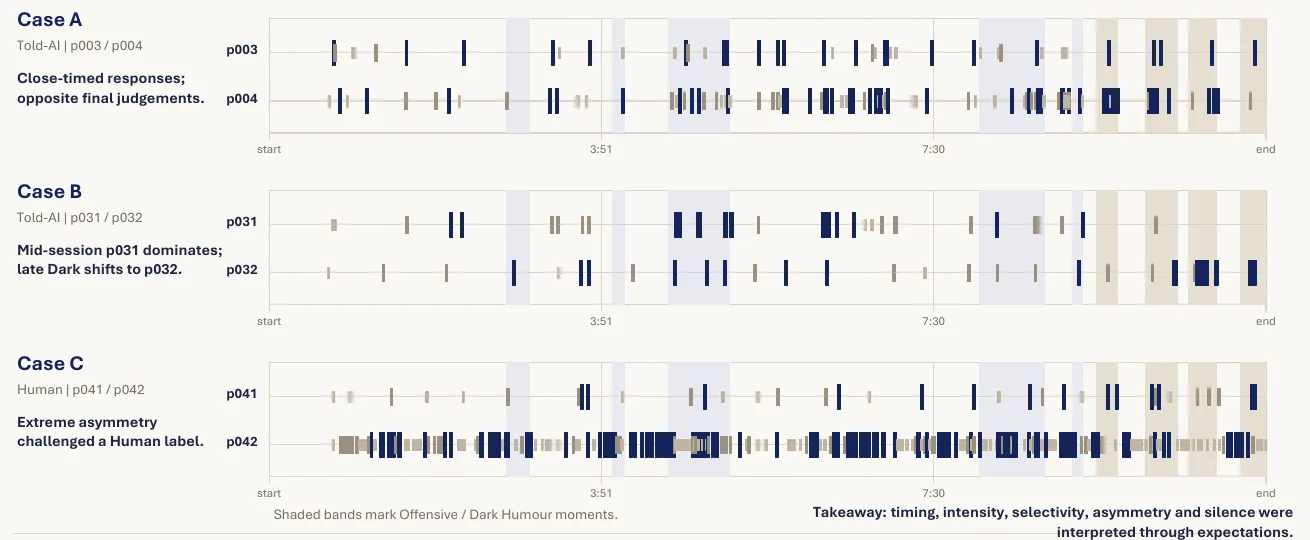
Timelines of laughter button presses for three pairs of participants across the video

01 Research question

Who we think is watching may shape how we respond.

When we watch something with other people, we notice when they laugh, how strongly, and whether it feels right. AI is starting to join these moments as companions, co-viewers and voice agents.

I asked whether people respond differently when their co-viewer is introduced as human or AI. Both conditions used the same three laughter sounds; participants chose when to trigger them. I examined response frequency, sound choices and the experience of watching together.

The outcome is an exploratory account of behaviour and interpretation, followed by design questions for AI co-viewers.

Five project stages: material collection, prototype exploration, pilot study, refinement, formal experiment
How the study developed Click to enlarge
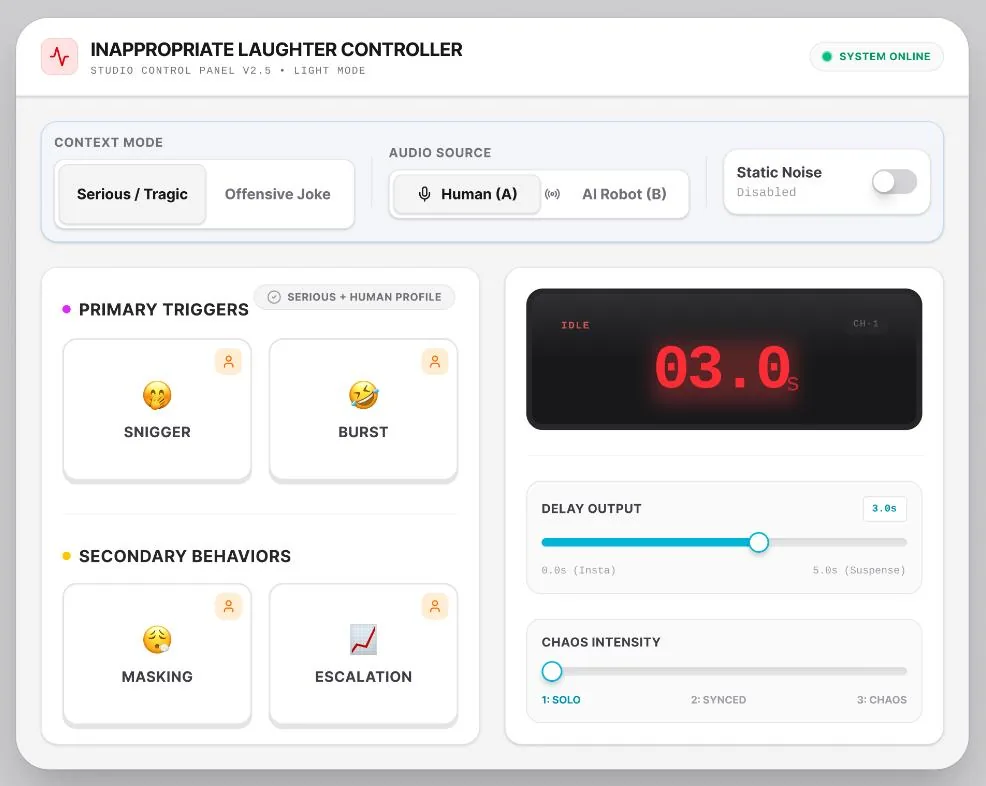
Early laughter soundboard prototype with controls for laughter type, delay, source and context
Early design probe Too many variables, later simplified

02 Study design

A shared video, with different identity instructions.

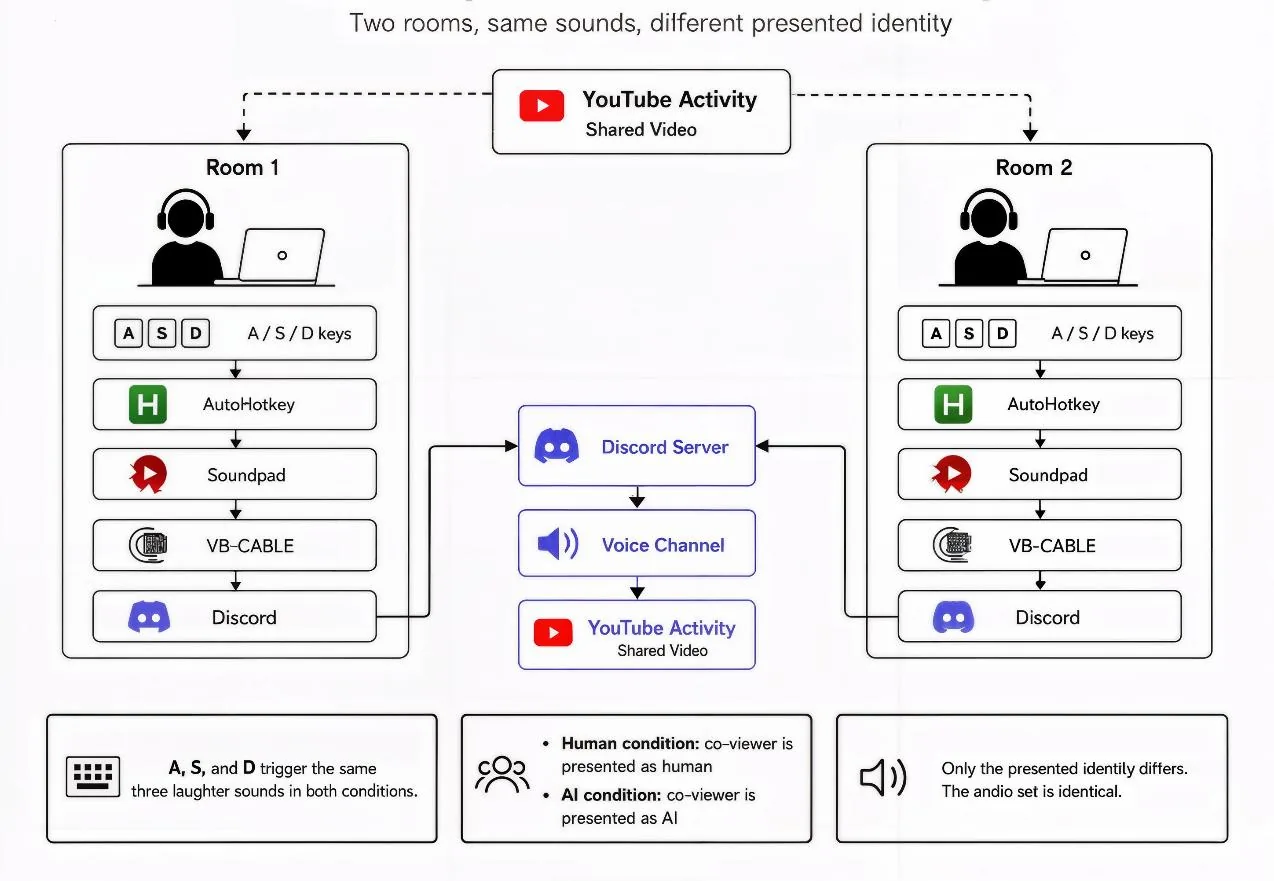
48 participants took part in 24 paired sessions: 12 pairs in Human and 12 in Told-AI. Each pair watched the same 11-minute video in separate rooms. They could not see or talk to each other; A, S and D triggered laughter sounds heard by their partner.

Technical setup: two rooms, A S D keys, AutoHotkey, Soundpad, VB-CABLE and Discord sharing one video
Technical setup Click to enlarge

How I introduced the co-viewer

Human condition. Told the co-viewer was another participant.

Told-AI condition. Told the co-viewer was an AI under development that reacts when it judges the moment fits.

The partner was another participant in both conditions. The three sound samples and the video were held constant, while the identity instruction changed. The timing and sequence of responses were generated by each pair, so the received audio was not identical across sessions.

The video contained 37 clips, coded as Normal, Amusing, Funny, Awkward, Offensive or Dark Humour. Three pilot participants independently checked my coding. Each key press was timestamped and linked to the clip being shown. These records capture a chosen sound response, rather than a recording of spontaneous laughter.
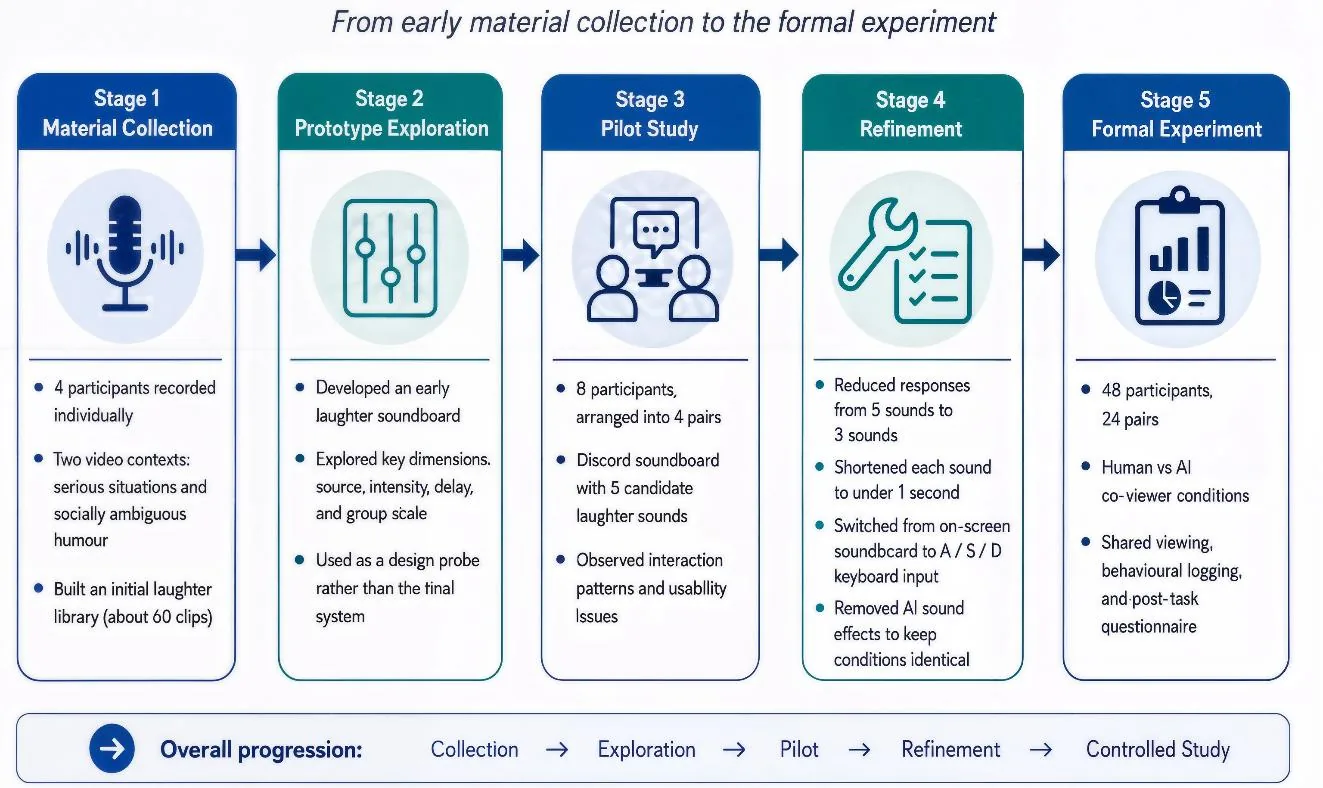
An 8-person pilot changed the setup. The on-screen soundboard drew attention away from the video, and the processed “AI” voice seemed to influence reactions itself. I moved the controls to the keyboard and used the same sound samples in both conditions to reduce those competing explanations.

03 Working with the data

Turning key presses into comparable evidence.

I used Excel to align the logs with the video, check event validity and summarise responses. Keeping the cleaning decisions visible mattered: repeated key events could otherwise inflate the totals.

  1. 01

    Align the clocks

    Converted clip boundaries to milliseconds and aligned event times with the video’s synchronisation point. Each event could then be assigned a clip and humour category.

  2. 02

    Check the recorded events

    Separated valid responses from records outside the analysis window. I then checked short-gap runs of repeated presses rather than treating every logged event as a separate response.

  3. 03

    Summarise in Excel

    Used FILTER, COUNTIFS and PivotTables to inspect responses by condition, sound and content. The reported results use the final cleaned event table.

  4. 04

    Choose the right comparison

    Kept counts separate from response shares. For humour categories with different exposure times, I compared responses per participant-minute instead of raw totals.

Workbook excerpt · final event table

Anonymised rows from order_B. Relative time is measured from the synchronisation point.

Five anonymised records from the final event table
ParticipantTime (s)ResponseClipCategory
p0027.187SuppressLaugh1Normal
p00235.812BigLaugh2Funny
p00237.640BigLaugh2Funny
p00138.703Nasal2Funny
p00238.984BigLaugh2Funny

Source: order_B · five Human-condition events · all marked Valid.

See one Excel calculation

Timeline!D3 converts the video timestamp in B3 into milliseconds.

=IF(B3="","",VALUE(LEFT(B3,2))*60000+VALUE(MID(B3,4,2))*1000+VALUE(RIGHT(B3,1))*100)

One cleaning decision that changed the total

The final review flagged runs with at least three events from the same participant and response, with every adjacent gap ≤60 ms. Keeping the first event in each run removed 419 repeated records. The original tables were preserved alongside the audit.

4,783

valid events before the final review

−419

repeat records removed

4,364

valid responses retained

Source: Cleaning_B_Audit · 26 flagged runs. The rule is a data-cleaning choice, not a claim that all rapid presses are accidental.

Why I adjusted for exposure

Reaction rate = valid responses ÷ (participants × clip duration in minutes). Both conditions had 24 participants and the same 72.6 seconds of Dark Humour. This makes the rate comparison explicit; it does not remove the fixed-order limitation.

04 Findings

Fewer responses. A higher share of BigLaugh.

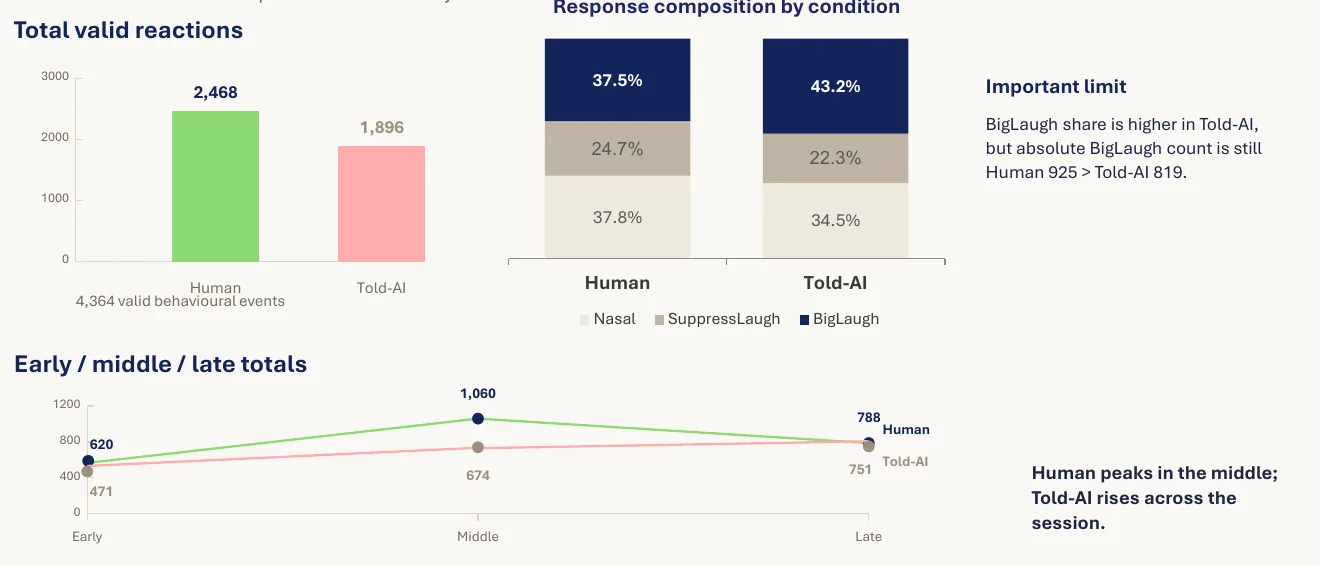
Told-AI produced fewer valid responses overall. Within those responses, BigLaugh accounted for a larger share. Human still had more BigLaugh presses in absolute terms: 925 versus 819. These are different measures of participation.

4,364

valid laughter responses from 48 participants.

2,468

responses in the Human condition, against 1,896 in Told-AI.

43.2%

of Told-AI responses were BigLaugh, against 37.5% in Human.

15/24

Told-AI participants ended up believing the co-viewer was an AI.

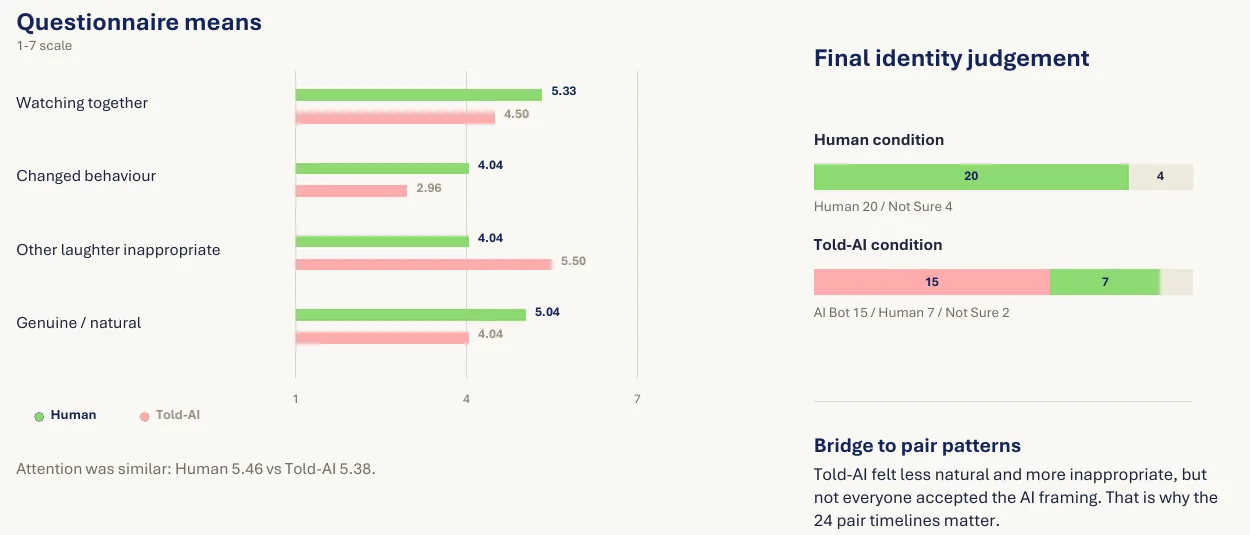
Self-reported attention was similar (5.46 in Human; 5.38 in Told-AI). That offers little support for an attention-only explanation, although these ratings do not establish why the response totals differed.

The pattern differed across content.

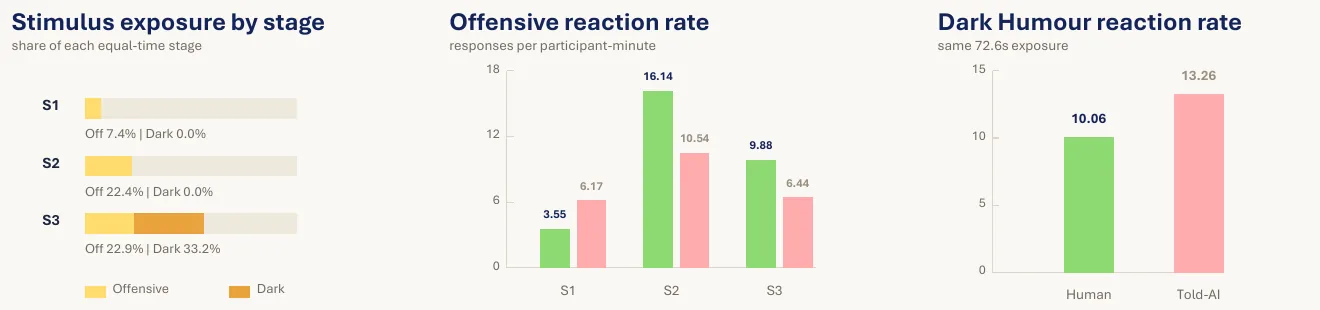
Offensive clips showed no consistent direction across the session: Told-AI had a higher reaction rate in the first third, while Human was higher in the second and third. A single overall total would hide that variation.

For Dark Humour, Told-AI had a higher reaction rate: 13.26 versus 10.06 responses per participant-minute. All Dark Humour clips appeared near the end, so content and session timing remain entangled. This is an observed pattern, not evidence that AI framing generally encourages dark humour.

Charts of total responses, response composition and responses across early, middle and late stages by condition
Overall behaviour Click to enlarge
Charts of Offensive and Dark Humour exposure by stage and reaction rates by condition
Offensive vs Dark Humour Reaction rate per participant-minute

Participants did not always believe the introduction.

Only 15 of 24 Told-AI participants finally believed they had watched with an AI; 7 thought it was a person and 2 were unsure. In the Human condition, 4 of 24 ended up unsure.

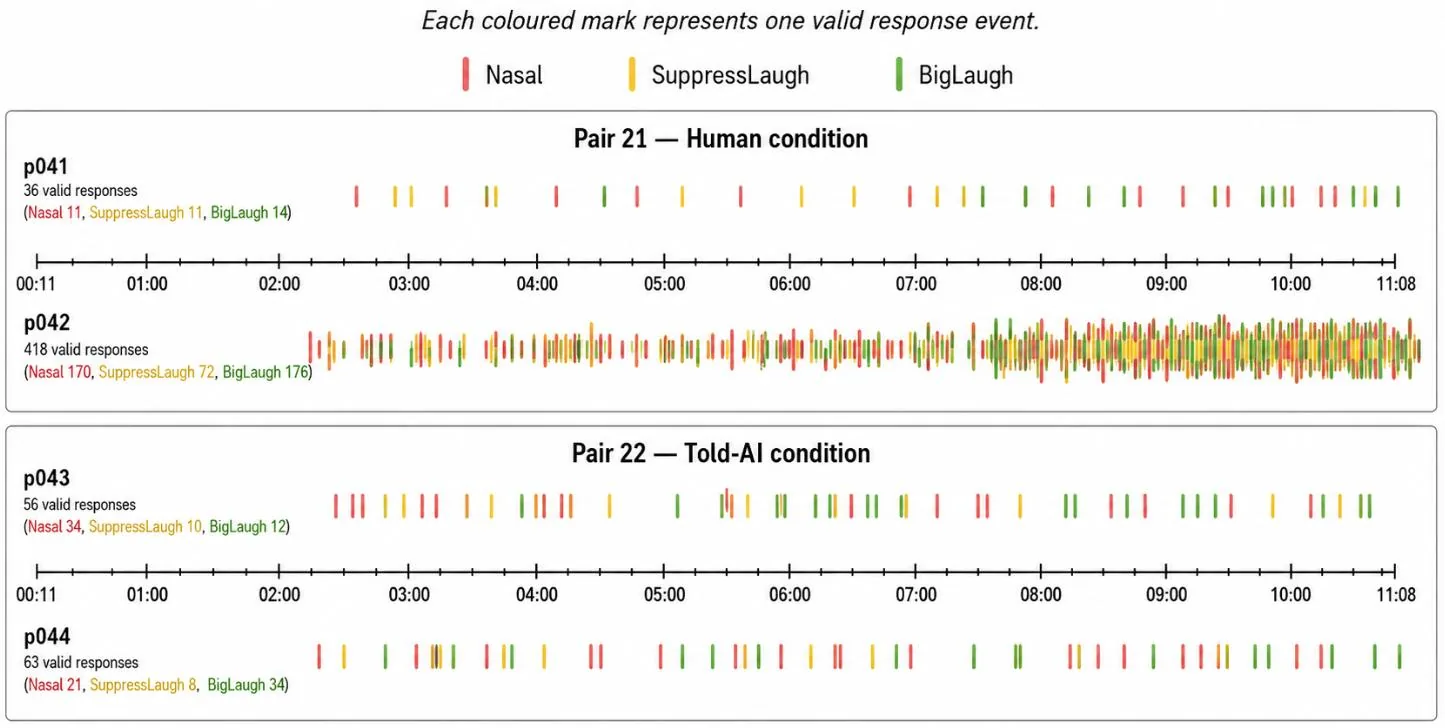
I reviewed all 24 pair timelines alongside participants’ accounts. Their explanations referred to response timing, silence, sound choice and humour taste. One Human-condition participant became unsure because the partner pressed “too much”; another interpreted an extreme response as human because they expected AI to stay within limits. These accounts help interpret the logs, but do not show when beliefs changed or who influenced whom.

Questionnaire means and final identity judgement by condition
Questionnaire and final identity judgement Click to enlarge
Full response timelines for Pair 21 and Pair 22, each mark one response
Two full pair timelines Close timing does not prove influence

05 Design implications

Questions to test in an AI co-viewer.

The study separates participation, sound choice and interpretation. I used those distinctions to propose the following directions. They have not yet been evaluated in a working AI system.

Participation and sound choice

Observed

Told-AI had fewer responses but a higher BigLaugh share.

Design direction

Let the system decide whether to respond separately from which sound to use.

Next test

Compare those decisions separately and ask users about presence and appropriateness.

Sensitive content

Observed

Offensive and Dark Humour did not show the same pattern.

Design direction

Consider the content before triggering laughter; a single response policy may miss important differences.

Next test

Vary content order and evaluate responses across several sensitive contexts.

How behaviour is interpreted

Observed

The same behaviour could support different identity judgements; final AI belief was incomplete.

Design direction

Consider how users interpret response timing and silence alongside the identity introduction.

Next test

Collect repeated identity judgements rather than relying only on an end-of-session question.

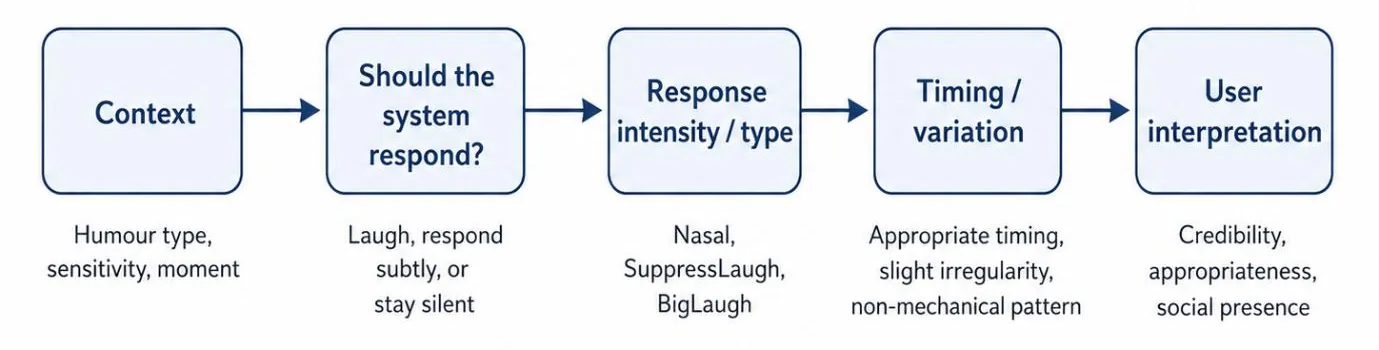
I came away with a more specific question than whether people laugh more with AI: how does an identity introduction interact with what happens during shared viewing? The logs describe participation, while the questionnaire and pair accounts show how differently the same limited signals can be interpreted.

Proposed design sequence: context, response decision, sound intensity, timing, user interpretation
Proposed design logic · a hypothesis for future evaluation

My part

What I contributed and what remains open.

  • RoleSole researcher on my MSc final project, supervised by Gregory Mills.
  • ResearchFramed the question, reviewed the literature, and compiled and coded the video.
  • ExperimentRecorded around 60 natural laughs, built the soundboard and logging setup, and ran the 8-person pilot and 24 paired sessions.
  • ExcelAligned timestamps, checked event validity and repeats, and built response summaries using formulas and PivotTables.
  • InterpretationReviewed every pair timeline alongside the questionnaire, then connected the findings to proposed design directions.
  • MethodsBetween-groups behavioural experiment, timestamped interaction logging, exposure-adjusted reaction rates, 7-point questionnaire, manipulation check, pair-level timeline analysis.

Limits of this study: the analysis is descriptive and exploratory, without significance testing. Fixed clip order confounds content with session timing. Key presses record chosen sound responses, not spontaneous laughter. Identity belief was measured only after viewing. A few active participants have substantial weight in pooled totals, and participants responded in pairs, so individual responses are not independent observations. Close timing does not establish influence. Further work should vary clip order and examine participant- and pair-level variation.